
FIGURE 4.
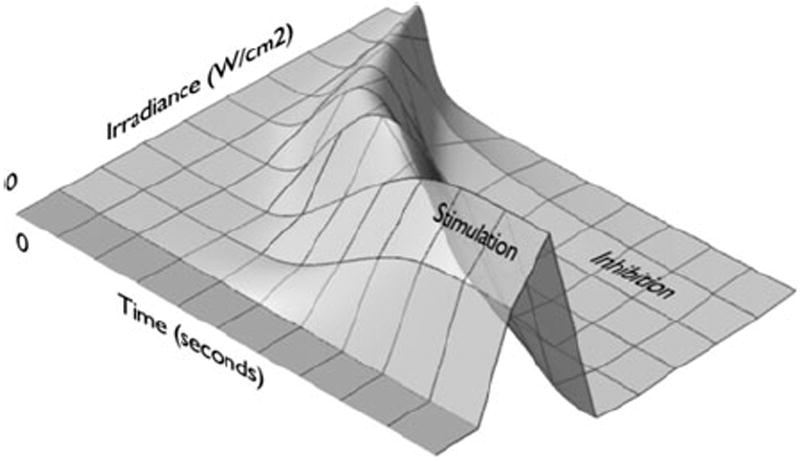
Biphasic dose response in LLLT. Three dimensional plot illustrating effects of varying irradiation time equivalent to fluence or irradiance on the biological response resulting in stimulation or inhibition.
Official websites use .gov
A
.gov website belongs to an official
government organization in the United States.
Secure .gov websites use HTTPS
A lock (
) or https:// means you've safely
connected to the .gov website. Share sensitive
information only on official, secure websites.
Biphasic dose response in LLLT. Three dimensional plot illustrating effects of varying irradiation time equivalent to fluence or irradiance on the biological response resulting in stimulation or inhibition.