
Figure 5.
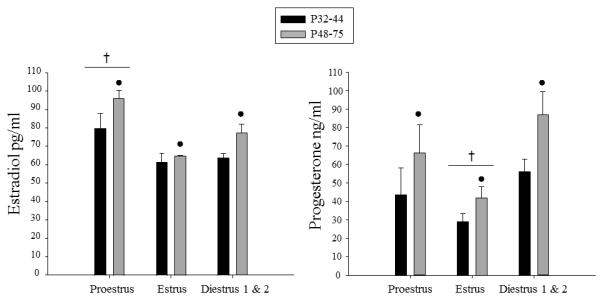
Mean estradiol and progesterone are shown across the phases of estrous in immature (P32-44) and mature (P48-75) females. The ● symbol indicates significant effects of age, whereas the † symbol represents significant differences in hormone levels between the phase indicated and the other two phases of the estrous cycle. The error bars indicate standard error of the mean.