
Figure 6.
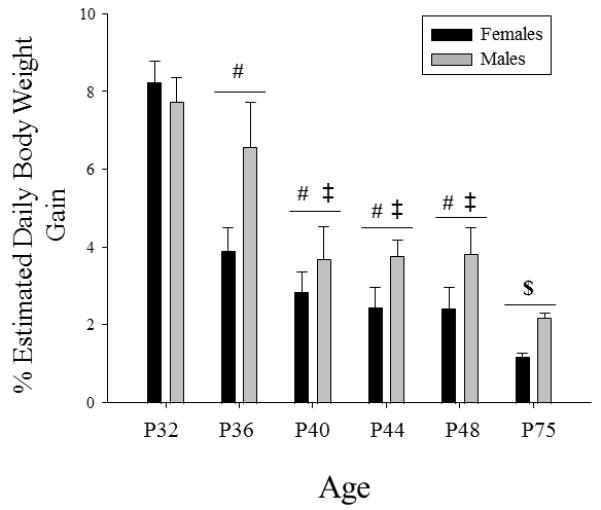
Mean estimated percent daily body weight gain is shown by sex across age. The # symbol indicates a significant difference from P32, whereas the ‡ indicates a significant difference from P36, and the $ symbol indicates a significant difference from all other ages. The error bars indicate standard error of the mean.