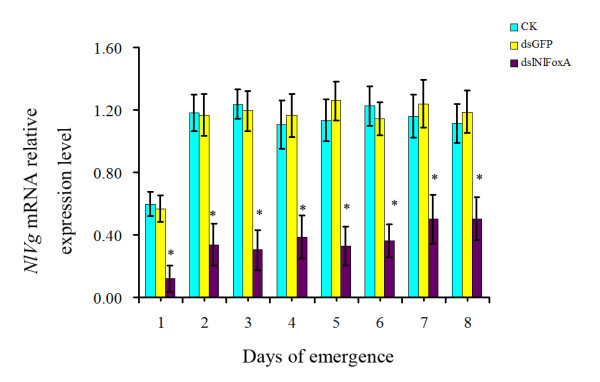
Figure 7.

The relative mRNA expression levels of NlVg after RNAi of NlFoxA gene. CK, Control; ds GFP, 0.5 μg/μlds GFP; ds NlFoxA, 0.5 μg/μl dsNlFoxA treated. respectively. The data represent the mean values ± S.E.M of three replicates. '*' means statistically significant difference in expression levels between CK and ds NlFoxA (t-test, p < 0.05).
