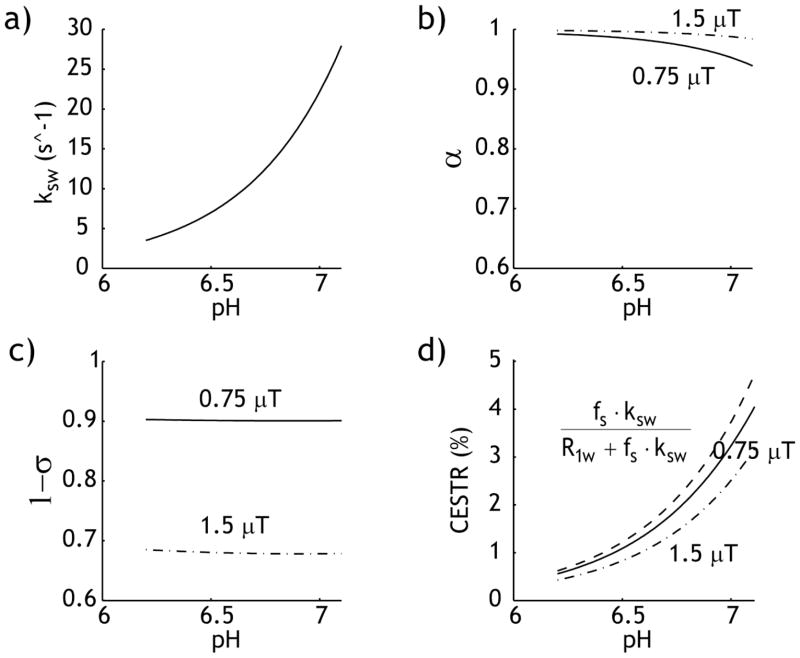
Fig. 1.
pH-dependent amide proton CEST MRI. a) Base-catalyzed amide proton exchange rate as a function of pH ksw=5.57×10pH–6.4. b) Labeling coefficient was calculated for a typical range of cerebral tissue pH. c) RF spillover factor degrades with RF power level. d) Comparison of the simplistic prediction (dashed, α=1 and σ=0) and calculated CEST contrast under two representative RF power levels, 0.75 (solid) and 1.5 μT (dash dotted).

