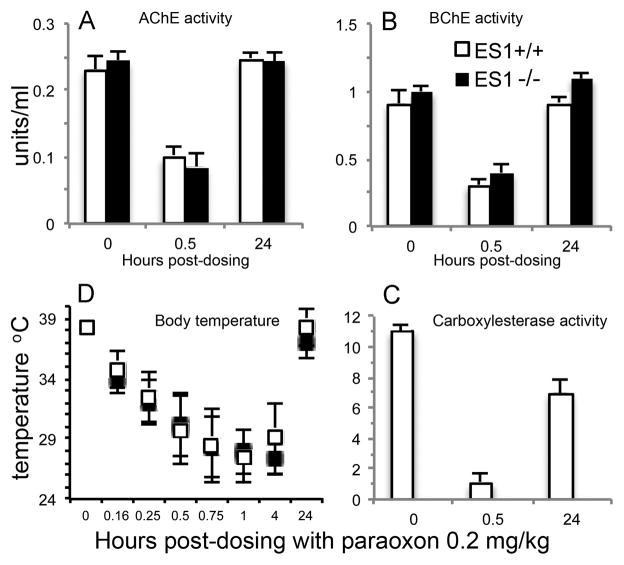
Figure 3.
Paraoxon challenge. A) plasma AChE activity; B) plasma BChE activity; C) plasma carboxylesterase activity; D) body temperature. Mice were challenged with 0.2 mg/kg paraoxon sc (n=3 per genotype). Points are shown ± std dev. Wild-type mice, ES1+/+, are represented by white bars and white squares. ES1−/− mice are represented by black bars and black squares.

