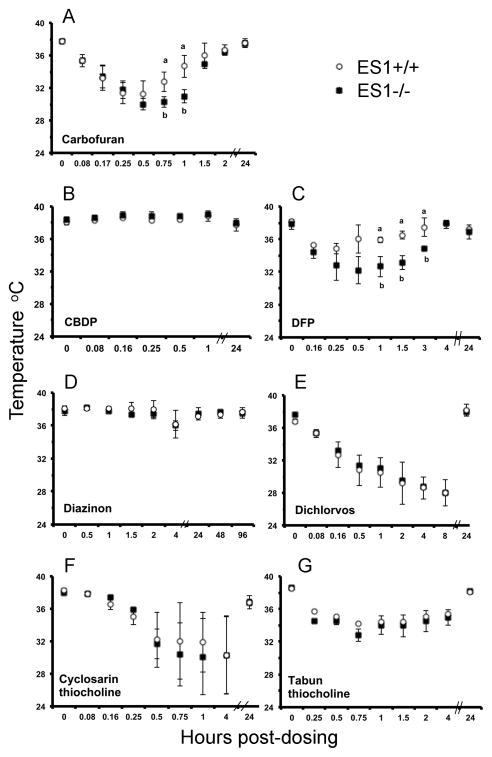
Figure 6.
Average surface body temperatures of mice after challenge with a single sublethal dose of a variety of toxicants. Points are shown ± std dev. Panel A, carbofuran (1 mg/kg); panel B, CBDP (20 mg/kg); panel C, DFP (4 mg/kg); panel D, diazinon (50 mg/kg); panel E, dichlorvos (7.5 mg/kg); panel F, cyclosarin thiocholine (0.05 mg/kg); and panel G, tabun thiocholine (6 mg/kg). The organophosphorus compounds were applied subcutaneously (n= 3 per genotype). Wild-type mice, ES1+/+, are represented by white circles. ES1−/− mice are represented by black squares. Measurements marked with an “a” are significantly different from those marked with a “b” based on a two tailed t-test p≤0.05.

