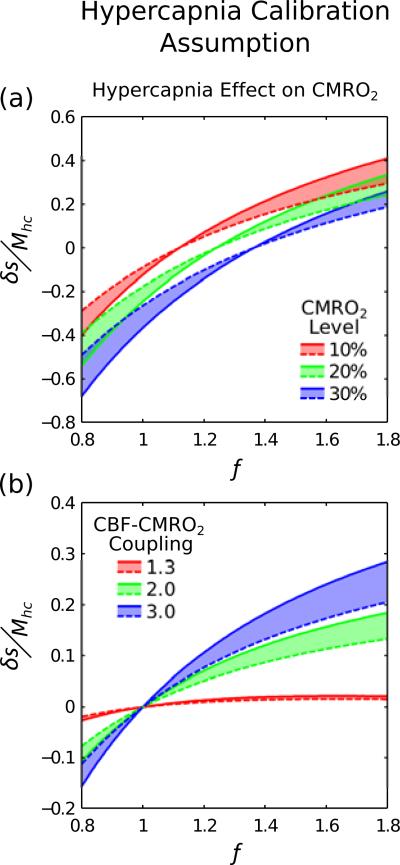
Figure 4.
It has been observed that hypercapnia may cause a reduction in baseline CMRO2. Here we consider what effect this would have on hypercapnia calibration when CMRO2 is reduced by 15% (r=0.85 in Eq. (3)). Physiological variability was not included for clarity. Isometabolism (r=1) is plotted as a solid line whilst reduced CMRO2 is plotted as a dashed line. Shifting of the dashed line with respect to the solid line suggests that reduced baseline CMRO2 would have a marked effect on the accuracy of hypercapnia calibration.

