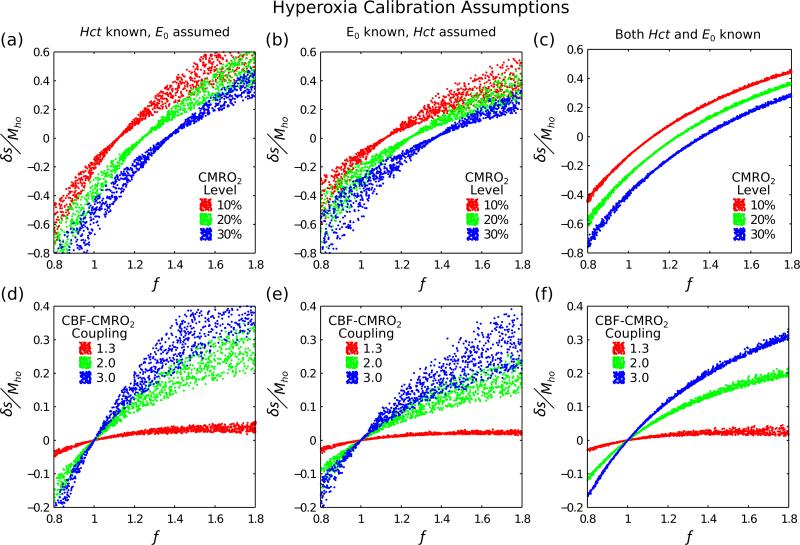
Figure 5.
Further investigation of hyperoxia calibration was undertaken to better understand the large observed variability. This was achieved by increasing the amount of information used to estimate the calibration scaling factor Mho; haematocrit known, oxygen extraction fraction known and both known (columns left-right). Physiological variability was included as it is the origin of the observed variability in Fig. 2b,e. More information about the baseline physiology reduces the variability in hyperoxia calibration.

