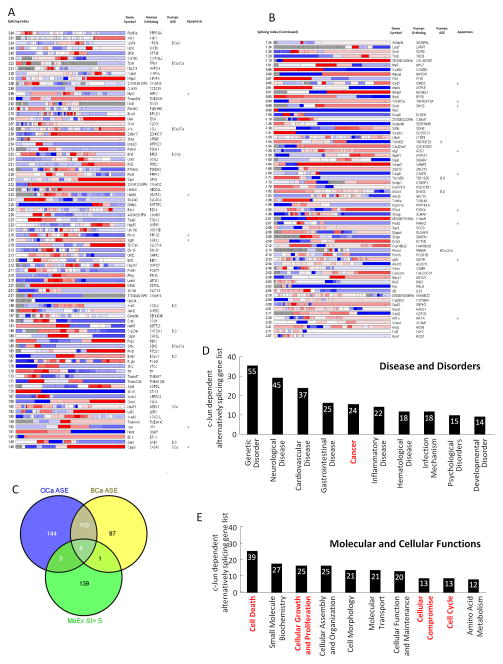
Figure 4. c-jun mediates alternative gene splicing.
(A) A plot gene display of the specific genes colored according to the expression of individual exons for each gene. Average gene expression of the specific exon is shown. The relative splicing index for each gene is shown with the gene symbol human ortholog and the presence of the alternatively spliced gene in human disease either BCa (breast cancer), OCa (ovarian cancer), O (ovarian), B (breast), or in apoptosis from Venables, 2009. (B) Data for human ASE association of alternatively spliced exon is taken from Venables, 2009. (C) Venn diagram representing the overlap between the c-jun dependent alternatively spliced gene sense (MoEx SI>.5) with overlap shown to OCa, ASE and BCa ASE (ovarian cancer alternatively spliced exons or breast cancer alternatively spliced exons). (D) Enrichment for gene function by ingenuity pathway analysis systems (IPA). The relative proportion of genes within the top functional gene networks is shown. (E) Proportion of the top seven genes by molecular and cellular function based on ingenuity pathway analysis.

