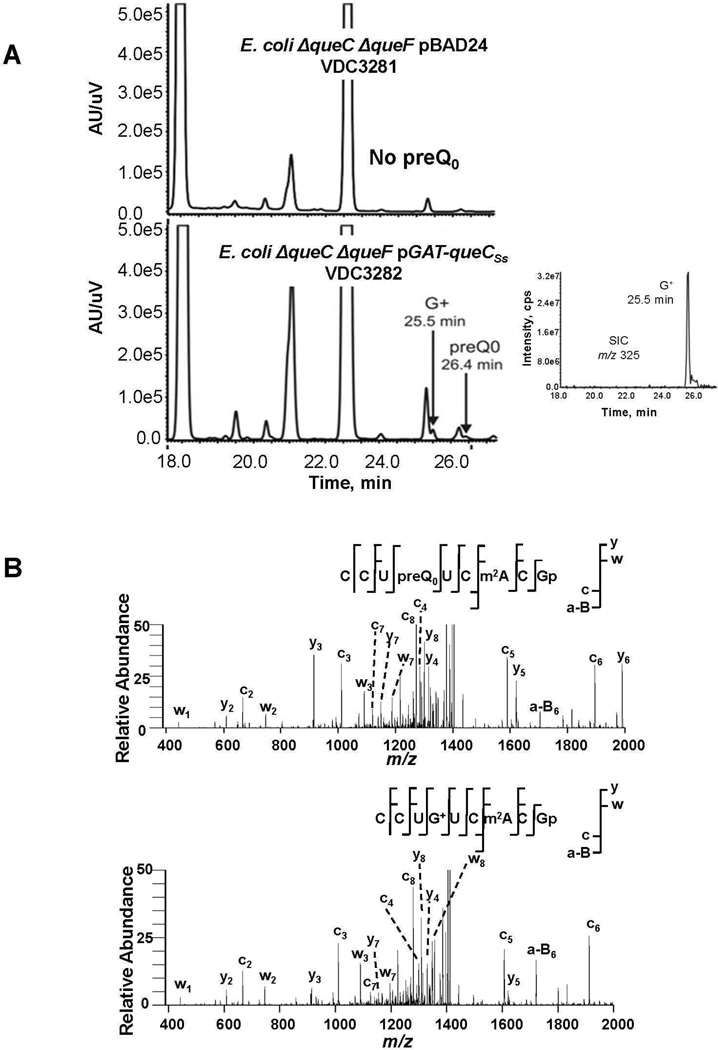
Figure 3. tRNA analysis extracted from the E. coli derivative strains.
A) Analysis of modified nucleosides extracted from E. coli ΔqueF ΔqueC derivative strains. The UV traces at 254 nm and the extraction ion chromatograms (inset) for 325 m/z are shown. The UV chromatogram of the bulk tRNA extracted from VDC3282 showed the G+ peak eluted at 25.5 min and preQ0 peak eluted at 26.4 min. The UV chromatogram of the bulk tRNA extracted from VDC3281 (the negative control) showed no preQ0 peak. B) LC-MS/MS of the RNase T1 digestion products from tRNAAsp purified from the ΔqueF strain. (top) CID of the m/z 1453 digestion product eluting at 30.6 min (Supplemental Figure 4). The detected a-B, c-, w- and y-type ions consistent with the sequence of CCUpreQ0UCm2AGp are identified in this mass spectrum. (bottom) CID of the m/z 1462 digestion product eluting at 29.4 min (Supplemental Figure 4). The detected a-B, c, w- and y-type ions consistent with the sequence of CCUG+UCm2AGp are identified in this mass spectrum.

