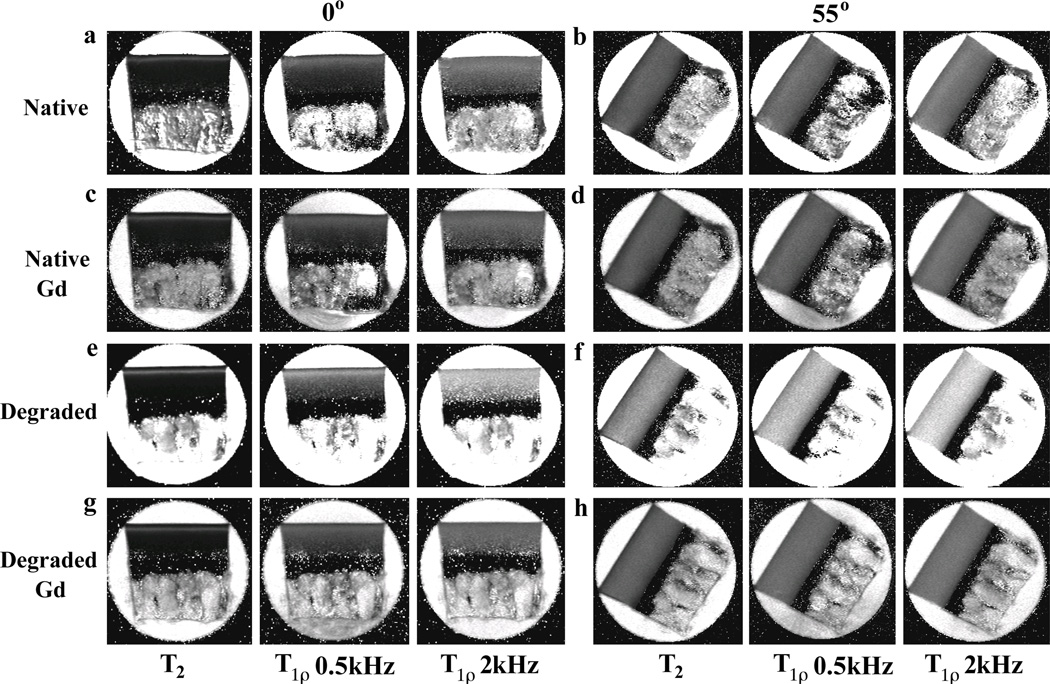
Figure 1.
T2 and T1ρ images at four sets of experimental conditions: (a–b) native specimens, (c–d) native specimens immersed in Gd-DTPA2−, (e–f) trypsin-degraded specimens, (g–h) trypsin-degraded specimens immersed in Gd-DTPA2−. All images were plotted with the same intensity limits (0 – 200 ms). The angles 0° (left) and 55° (right) refer to the orientation between the normal axis of the surface and the magnetic field (vertically up).

