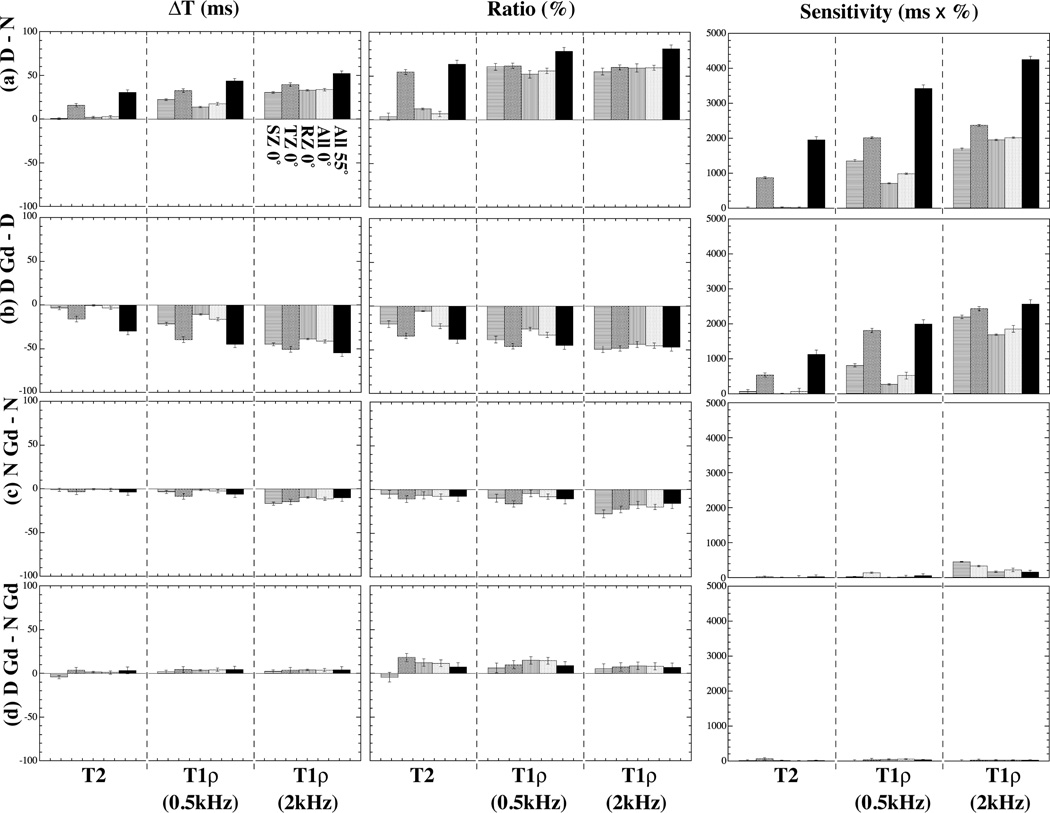
Figure 4.
The zonal averaged differences of T2 and T1ρ at 0° and 55°. The left column: the difference of relaxation measurement (ΔT in ms); the middle column: the percentage ratio of relaxation measurement (%); the right column: the sensitivity of relaxation measurement (ms × %). (a) – (d) correspond to the four sets of comparisons shown in Fig 3.

