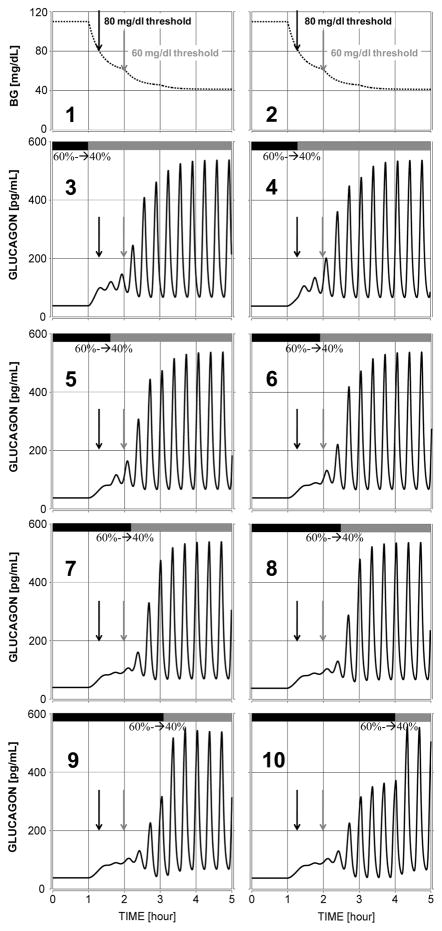
Figure 5.
Plots 3 to 10: GCR response to different onset of a switch (black/gray bars) from 60% reduction to 40 % reduction of glucagon in order to restore both basal and hypoglycaemia-stimulated glucagon secretion: Plots 1–2: simulated stepwise BG decline into hypoglycaemia Left black arrow 80 mg/dl; Right grey arrow 60 mg/dl

