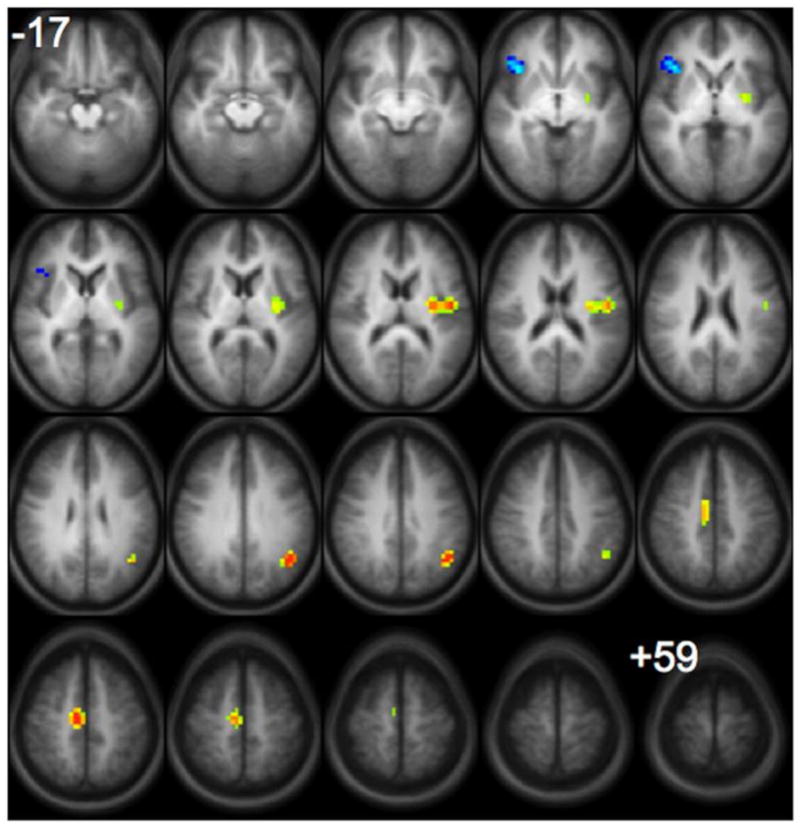
Figure 3.

Statistical map showing group composite activation that is greater for subsequently remembered (hot colors) versus subsequently forgotten (cool colors) words for the “generate” condition. (There were no significant differences for this comparison in the “read” condition). All images are in radiological convention (right on the image corresponds to left in the brain) and span z-coordinates −17 to +59 in 4mm increments. Statistics for the clusters are listed in Table 2.
