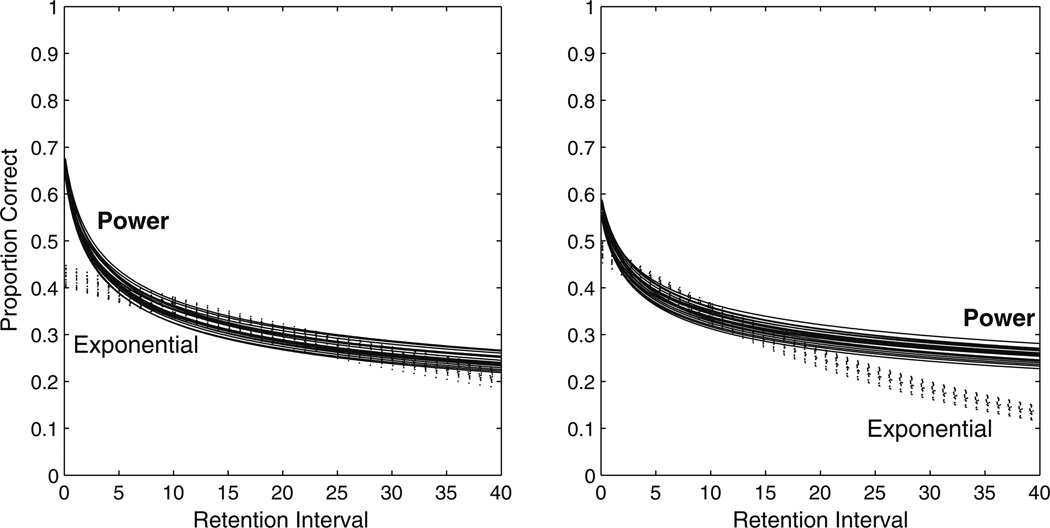
Fig. 1.
Power and exponential curves for two different ranges of parameters show that the regions where the models are discriminable can change depending on the parameter estimates. On the left, parameter ranges of 0.65 < a < 0.70 and 0.25 < b < 0.30 for the power model and 0.40 < a < 0.45 and 0.015 < b < 0.020 for the exponential model create curves that overlap after about 5 s, making them most discriminable for retention intervals shorter than 5 s. On the right, parameter ranges of 0.55 < a < 0.60 and 0.20 < b < 0.25 for the power model and 0.45 < a < 0.50 and 0.030 < b < 0.035 for the exponential model create curves that overlap for all retention intervals shorter than 15 s, making them most discriminable for retention intervals longer than 15 s

