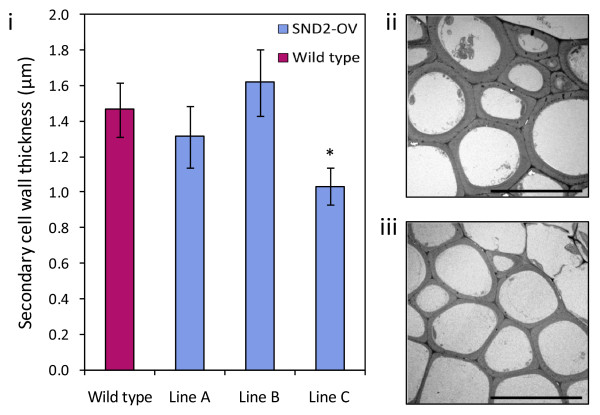
Figure 3.
(i) SCW thickness in IFs of eight-week-old wild type and T4 homozygous SND2-OV lines A, B and C. Measurements are based on scanning electron micrographs. Error bars indicate the standard error of the mean of three biological replicates (21-42 fibres were measured per line). *Significantly different from wild type according to homoscedastic two-tailed Student's t-test (P < 0.02). Transmission micrographs of representative IF regions of wild type and SND2-OV line C stems are shown in (ii) and (iii) respectively (scale bars = 20 μm).

