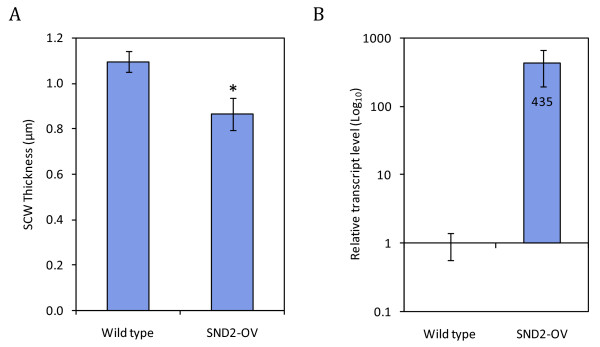
Figure 4.
Effect of SND2 overexpression on IF wall thickness in T1 generation stems. (A) Mean SCW thickness in IFs of eight-week-old wild type and T1 generation SND2-OV stems. Representative light microscopy images are shown in Additional file 1, Figure S5. Error bars indicate the standard error of the mean of eight wild type and seven T1 plants (26-48 fibres were measured per plant). *Significantly different from wild type based on homoscedastic two-tailed Student's t-test (P < 0.02). (B) Corresponding transcript abundance of total SND2 transcript in lower stems of six wild type and six SND2-OV T1 plants used for SCW measurements, as measured by RT-qPCR. The primer pair quantifies endogenous and transgenic SND2 transcript. Total SND2 transcript is ~435-fold relative to the wild type, represented here on a log10 scale. Calibrated Normalized Relative Quantity (CNRQ) values were obtained by normalization against three control genes. Error bars indicate the standard error of the mean of six plants.

