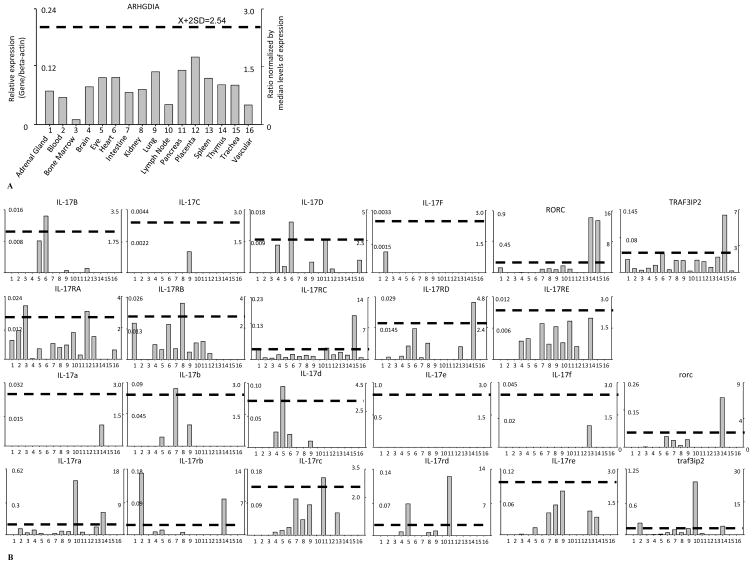
Figure 2.
A. Data Presentation Format (The data presented in X-, Y-axis and tissue order are applied to all the genes examined). B. Tissue Expression Profiles of IL-17 cytokines and receptors, RORC, and TRAF3IP2. The gene expression profiles of IL-17 cytokines and receptors, TRAF3IP2, and RORC in mouse and human tissues. A) As an example, the gene expression profiles of human housekeeping gene Rho GDP dissociation inhibitor (GDI) alpha (ARHGDIA) in the sixteen tissues including adrenal gland, blood, bone marrow, brain, eye, heart, intestine, kidney, lung, lymph node, pancreas, placenta, spleen, thymus, trachea, and vascular are presented, with the tissue names and position numbers are shown on the X-axis. The gene expression data were normalized by the β-actin (Hs.520640) expression data from the same tissue, which are presented on the left Y-axis. The expression ratios among tissues were generated by normalizing the arbitrary units of the gene in the tissues with the median level of the arbitrary units of the gene in all the tissues which are presented on the right Y-axis. In order to define confidence intervals for statistically higher expression levels of given genes, we calculated the confidence intervals of tissue expression [the mean X + 2 x standard deviations (SD) = 2.54] for three housekeeping genes including Rho GDP dissociation inhibitor alpha (ARHGDIA, Hs.159161), glyceraldehyde-3-phosphate dehydrogenase (GAPDH, Hs.544577), and ribosomal protein S27a (RPS27A, Hs.311640). The expression variations of given genes in tissues, when they were larger than 2.54-fold, were defined as the high expression levels with statistical significance (the right Y-axis). To define confidence intervals for statistically higher expression levels of given genes in mouse tissue, we calculated the confidence intervals of tissue expression [the mean X + 2 x standard deviations (SD) = 2.67] for three mouse housekeeping genes including Lactate dehydrogenase A (Ldha, Mm.29324), non-POU-domain-containing octamer binding protein (Nono, Mm.280069), and ribosomal protein L32 (Rpl32, Mm.104368). The expression variations of given genes in tissues, when they were larger than 2.67-fold, were defined as the high expression levels with statistical significance (the right Y-axis). B) The expression profiles of IL-17 cytokines and receptors, TRAF3IP2, and RORC in human tissues (top two rows, with cytokine and receptor family members designated with capital letters) and mouse tissues (bottom two rows, with cytokine and receptor family members designated with lowercase letters). The X-axis indicates the sixteen tissues examined in the same order as that shown in Figure 2A with position numbers shown.

