Fig. 1.
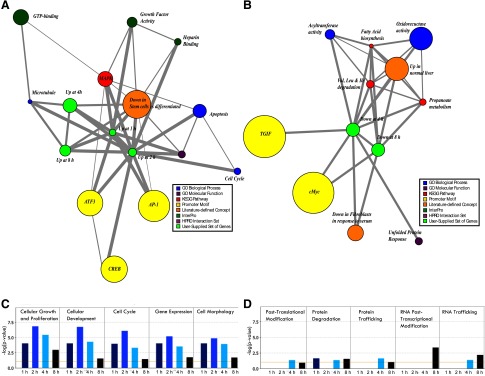
A, B: molecular concept mapping (MCM): graphical representation of statistically derived association networks between genes of interest and color-coded molecular concepts (see color legend). Size of a node reflects number of genes in the set and the thickness of the line relates to odds ratio of the association. A: associations with gene sets up at 1,2,4 and 8 h of protease inhibitor (PI) feeding (green nodes). B: associations with gene sets down at 4 and 8 h of PI feeding (green nodes). Not enough genes were down at 1 or 2 h to conduct an analysis. C, D: a compiled Ingenuity cell and molecular function categorization analysis for 1 h, 2 h, 4 h and 8 h of PI feeding. C: top 5 functional categories altered at 1–4 h. D: top 5 functional categories altered at 4–8 h.

