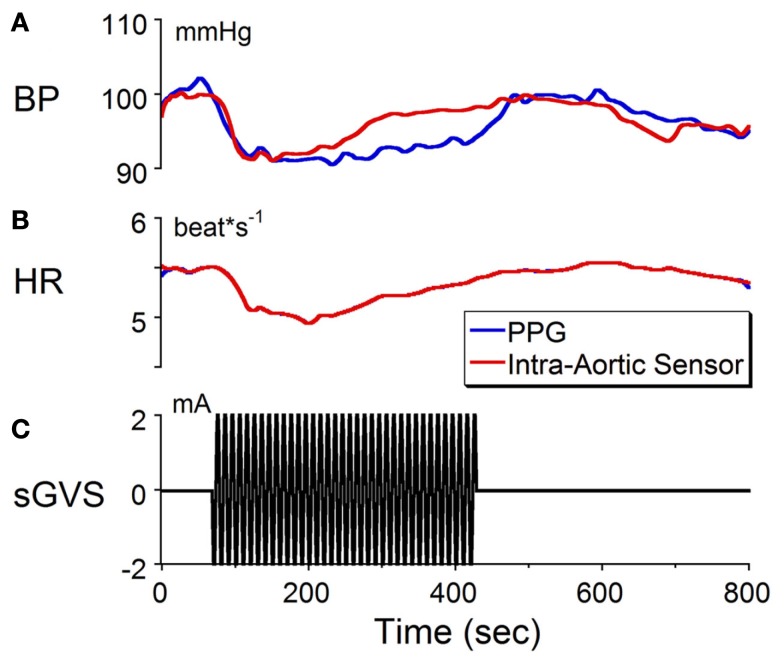
Figure 1.
Changes in (A) blood pressure (BP) and (B) heart rate (HR) in response to sinusoidal galvanic vestibular stimulation (sGVS) at 0.1 Hz, 2 mA (C). BP fell from 100 to 90 mmHg and HR decreased from 5.5 to 5.1 beats/s. The calibration for BP was taken from an implanted intra-aortic sensor (red trace). Although the changes in BP from the PPG (blue trace) were uncalibrated, the waveforms obtained from PPG and intra-aortic sensors follow similar time courses. Changes in HR, which were calculated from the systolic changes in BP, were the same for the intra-aortic sensor and for PPG. See Section “Materials and Methods” for a further description of processing of the PPG. These results verify that changes in BP and HR can be detected and quantified using PPG data.

