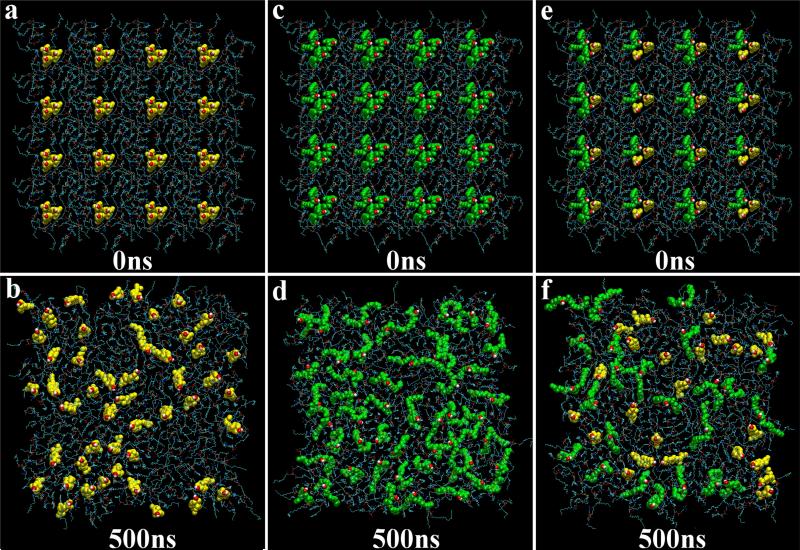
Figure 2.
(a) and (b): The initial and final snapshots of POPC/18.75%CHOL system. Only the lipids on the top leaflet are shown. POPCs are represented by thin lines, and cholesterol molecules (in yellow) are represented by the space-filling model. The red spheres are O6 atoms of cholesterol. (c) and (d): The initial and final snapshots of POPC/18.75%DAG system. DAGs (in green) are represented by the space-filling model. The red spheres are O2 atoms of DAG. (e) and (f): The initial and final snapshots of POPC/DAG/CHOL system.

