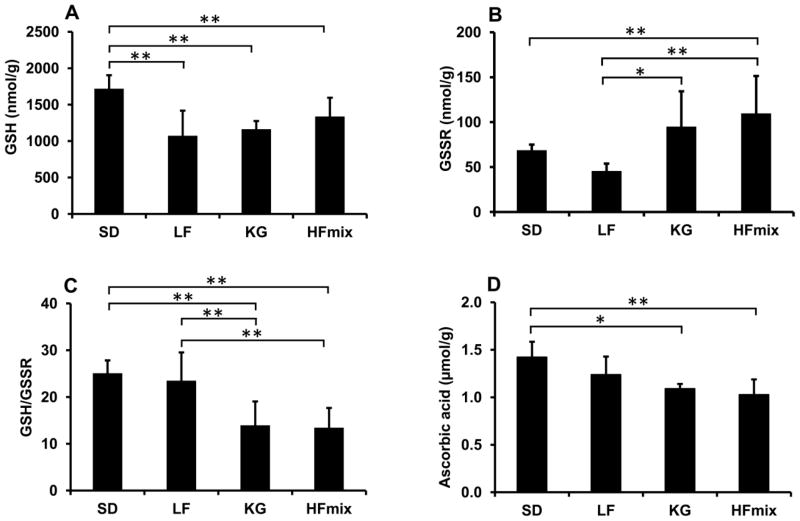
Figure 6.
The concentration of glutathione (GSH) (A), the concentration of the oxidized glutathione and conjugated glutathione (GSSR) (B), the ratio of GSH/GSSR (C) and the concentration of ascorbic acid (D) in the livers from rats fed the different diets. The statistical significance among the different diet groups was determined by ANOVA analysis verified by a Bartlett test. And Tukey’s Post Hoc test was used to determine significant differences between each group after ANOVA analysis. (**p<0.01 and *P<0.05, n=6). The data was calculated based on the wet weight of liver tissues.

