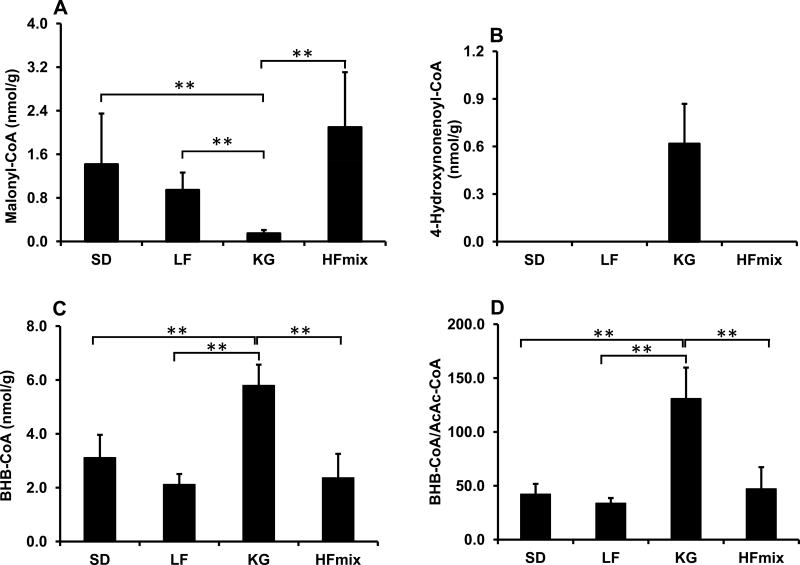
Figure 7.
The concentrations of Acyl-CoAs in the livers from rats fed the different diets. A: Malonyl-CoA, B: 4-hydroxynonenoyl-CoA, C: BHB-CoA, and D: BHB-CoA/AcAc-CoA. The statistical significance among the different diet groups was determined by ANOVA analysis verified by a Bartlett test. And Tukey’s Post Hoc test was used to determine significant differences between each group after ANOVA analysis. (**p<0.01 and *P<0.05, n=6). The data was calculated based on the wet weight of liver tissues.

