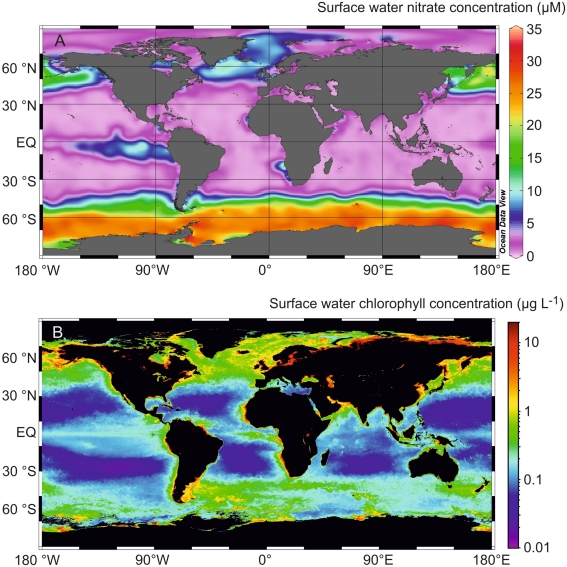
Figure 1.
(A) Annualized average nitrate (μM) and (B) composite chlorophyll a (mg L−1) distributions observed in surface waters in the global ocean. The nitrate distribution was obtained using data from the World Ocean Atlas 2009 (http://www.nodc.noaa.gov/OC5/WOA09/pr_woa09.html), while the chlorophyll a distribution represents the 2009 Aqua MODIS chlorophyll composite (http://oceancolor.gsfc.nasa.gov/cgi/l3).

