Abstract
The NOW® Malaria Test, an immunochromatographic test (ICT), was evaluated to determine its ability to quantitatively detect malaria parasites using 100 blood samples from Thailand, including 50 Plasmodium falciparum (Pf) infections and 50 P. vivax (Pv) infections. Intensities of the thickness of the visible bands of the positive ICT were compared with the parasite densities. In cases of Pf infection, the intensities of both HRP-2 bands (T1 bands: Pf specific bands) and aldolase bands (T2 bands: pan-Plasmodium bands) correlated with the parasite densities. The intensities of T2 bands in Pf positive samples showed better correlation with the parasite densities than the T1 bands. In the cases of Pv infection, the intensities of T2 bands were also well correlated with parasite density. These results suggest that the ICT is useful not only for rapid detection of malaria parasites but also for estimating parasite density.
Keywords: Immunochromatographic test (ICT), malaria, Plasmodium falciparum, Plasmodium vivax, quantitative diagnosis, rapid diagnosis
Introduction
The NOW® Malaria Test (Binax, Inc., Portland, ME, U.S.A.) is a rapid diagnostic test (RDT) based on an immunochromatographic test (ICT). The test detects the histidine-rich protein-2 (HRP-2) of Plasmodium falciparum (Pf) (as T1 band on the test window) and aldolase, a common antigen of four species of human malaria parasites (as T2 band on the test window) in the whole blood [1]. Previous studies have reported the superior performance of the ICT and its sensitivity and specificity in detecting and discriminating the malaria parasite in clinical blood samples. Thus, the ICT test has come to be recognized as a convenient tool for the rapid detection of malaria parasites [1, 2]. In addition to information on parasite species, knowledge of parasite density is important for epidemiological surveys and patient treatment. However, while there have been extensive investigations into the sensitivity and specificity of the ICT in detecting malaria, only a few reports have mentioned its capability with regard to quantitative detection [3, 4]. In this study, we examine the quantitative performance of the NOW® Malaria Test using the intensity/thickness of the positive bands to estimate Pf and Pv parasite densities in clinical blood samples obtained from malaria patients in Thailand, and we discuss the utility of the ICT for rapid quantitative detection of malaria parasites in Pf and Pv infections.
Materials and Methods
Blood samples
Blood samples were collected with ethylenediaminetetraacetic acid (EDTA) from patients at the Hospital for Tropical Diseases, Mahidol University, Thailand in 1997. At the same time, Giemsa-stained thin blood smears were prepared. The smears were examined microscopically by well-trained hospital staff. Fifty samples diagnosed as Pf single infection and 50 diagnosed as Pv single infection were selected and subjected to this study. The whole blood samples were stored at –30°C until immunochromatographic tests were performed. The study was approved by the Ethics Committee of Faculty of Tropical Medicine, Mahidol University.
ICT
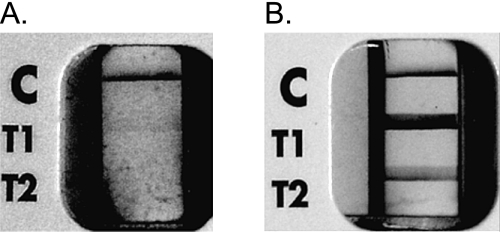
The NOW® Malaria Test (Binax, Inc., Portland, ME, U.S.A.) was used for this study. The test was performed according to the manufacturer’s instructions using thawed whole blood samples. Results were determined on the basis of the appearance and intensities of T1 and T2 bands in the test window of the device. The intensity of test bands was graded visually and ranged from 0 (negative: no visible reaction for T1 or T2); 1 (weak: narrow trace of reaction); 2 (moderate: clear but thin reaction) to 3 (intense: broad and thick reaction) (Fig. 1). The staff reading the ICTs were unaware of the results of microscopic observation of parasite species and parasitic density in the samples.
Fig. 1.
NOW® Malaria ICT results.
(A) Test window with bands for low Pf parasitemia (T1 band intensity of 1, and T2 band intensity of 0).
(B) Test window with bands for high Pf parasitemia (T1 band intensity of 3, and T2 band intensity of 2).
C = Positive procedural control band
Data analysis
The correlation of intensities of bands on ICT test readings to the log 10 of values of parasite densities were assessed using Pearson product-moment correlation coefficients (R).
Results
Of the 50 Pf positive samples confirmed by microscopy, 49 samples exhibited a positive T1 band and were diagnosed as Pf malaria by the ICT (Table 1). The sensitivity of the T1 band was 98%. Forty-five samples co-exhibited a positive T2 band with T1 positivity (Table 1). Microscopic examination of the sample that exhibited a false negative reaction in relation to T1 band revealed that it had a very low parasite density (84 parasitized red blood cells (pRBCs)/µl).
Table 1.
Results of ICT for Pf infected blood samples.
| Microscopy | Intensity of T1 band* | Intensity of T2 band* | ||||||||
| Pf density (pRBC/µl) | No. | 0 | 1 | 2 | 3 | 0 | 1 | 2 | 3 | |
| 0–100 | 6 | 1 | 2 | 2 | 1 | 3 | — | 3 | — | |
| 100–1000 | 8 | — | 1 | 5 | 2 | 1 | 5 | 2 | — | |
| 1000–10000 | 16 | — | 2 | 8 | 6 | 1 | 7 | 8 | — | |
| 10000– | 20 | — | — | 3 | 17 | — | — | 10 | 10 | |
Results were classified according to the level of parasite density determined by microscopy.
*0 = negative; 1 = weak; 2 = moderate and 3 = strong
—: No samples.
Of the 50 Pv positive samples confirmed by microscopy, 48 exhibited a positive T2 band while negative for T1 band and were diagnosed as Pv infected. Thus, the ICT demonstrated a sensitivity of 96%. A negative T2 band was only indicated in two positive samples by the ICT. These samples also showed low parasite densities (79 and 522 pRBCs/µl) (Table 2). In addition, the parasite densities of each of the samples confirmed by microscopy were also verified by real-time quantitative PCR using the thawed samples (data not shown).
Table 2.
Results of ICT for Pv infected blood samples.
| Microscopy | Intensity of T2 band* | ||||
|---|---|---|---|---|---|
| Pv density (pRBC/µl) | No. | 0 | 1 | 2 | 3 |
| 0–100 | 1 | 1 | — | — | — |
| 100–1000 | 10 | 1 | 3 | 6 | — |
| 1000–10000 | 19 | — | — | 14 | 5 |
| 10000– | 20 | — | — | 4 | 16 |
Results were classified according to the level of parasite density determined by microscopy.
*0 = negative; 1 = weak; 2 = moderate and 3 = strong
—: No samples.
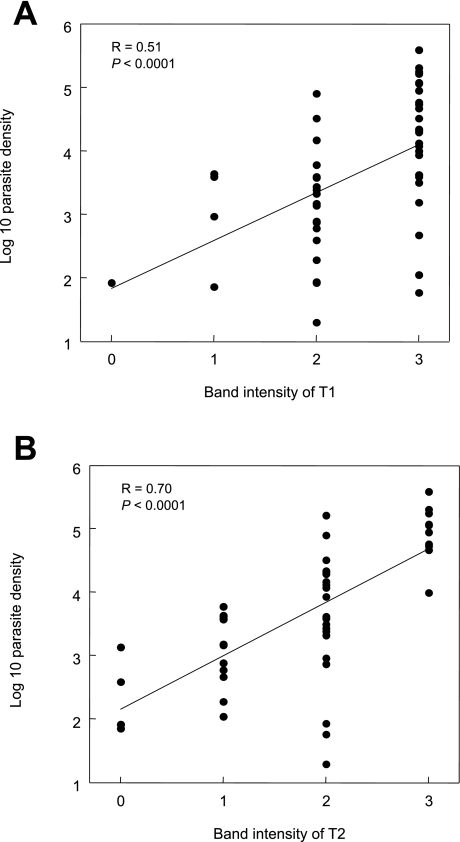
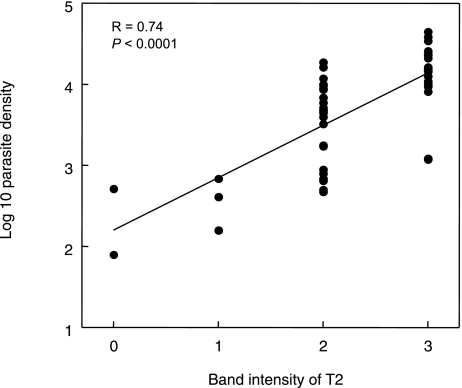
The readings, subjectively classified into four grades—0: negative; 1: weak; 2: moderate; and 3: intense—and were plotted against the log 10 of values of parasite densities determined by microscopy for each sample (Fig. 2 and Fig. 3).
Fig. 2.
Comparison of T1 and T2 band intensity read by the ICT test window and Pf density of each blood sample.
The T1 band is shown in (A). The T2 band is shown in (B).
Each dot indicates a single data point.
Linear regression and Pearson product-moment correlation coefficient (R) are indicated in each field.
Fig. 3.
Comparison of the T2 band intensity read by the ICT test window and Pv density of each blood sample.
Each dot indicates a single data point.
Linear regression and Pearson product-moment correlation coefficient (R) are indicated in the field.
For Pf infected samples, the intensities of the T1 bands correlated with the parasite densities (R = 0.51, P < 0.0001; Fig. 2A). However, several samples showed intense T1 bands in spite of their low parasite densities. The intensities of the T2 bands of Pf positive samples, on the other hand, showed better correlation with parasite densities (R = 0.70, P < 0.0001). Parasite densities higher than 10,000 pRBCs/µl only showed intense T2 bands (Fig. 2B).
For Pv infected samples, the intensities of T2 were also well correlated with parasite densities (R = 0.74, P < 0.0001; Fig. 3).
Discussion
The T1 band of the ICT was demonstrated to have excellent sensitivity for the detection of Pf. This is consistent with previous reports [3, 4]. Only one sample with a low parasite density of 84 pRBCs/µl was incorrectly diagnosed as negative by the ICT. Thus, the false negative result might have been caused by the extremely low parasitemia. For detection of Pv, the sensitivity of the T2 band of the ICT was 96%. Again, it is possible that the two false negatives occurred due to low parasite density [3, 5]. These results reconfirmed the high sensitivity of the Now® Malaria Test and its ability to detect Pf and Pv infection.
In our attempt to evaluate the quantitative ability of the ICT test for Pf diagnosis, significant correlations were observed between the intensities of both the T1 and T2 bands in the ICT test window and parasite densities. Previous studies described that these band intensities varied with parasite densities in crude correlations [3, 4]. However, in this study, it was also demonstrated that the correlation between band intensity and parasite density was more significant in the T2 band than in T1 band in the Pf positive group. These results suggest that the T1 band is an extremely sensitive marker for Pf infection, whereas the T2 band is not suitable for detection of Pf infection because of its relatively higher number of false negatives for Pf infection (5/50) (Table 1).
While mixed infection of Pf and other Plasmodium species might be suspected when T1 and T2 are co-positive, in this study the possibility of mixed infection in the co-positive samples was ruled out by skilled microscopists. In a study using 674 samples from malaria endemic areas, Richter et al. (2004) reported that the co-reactivity of T1 and T2 bands indicated high-parasitemia of Pf rather than mixed infection [6]. In this context, our results also suggest the utility of the T2 band as a quantitative indicator of relatively higher Pf parasite density when it appears in conjunction with T1 band. Moreover, the T1 band remains positive after treatment, even in cases where there are no findings by microscopy, because HRP-2 can sometimes persist after the clearance of peripheral parasitemias [2], while a decline is usually observed in the intensity of the T2 band during treatment [6]. These findings also suggest the utility of T2 band as an index of living parasites in the blood.
In our quantitative analysis of the Pv positive group, a significant correlation was found between the intensities of T2 bands and parasite densities. This was also observed in the analysis of Pf infection, although previous studies described a crude correlation between T2 band intensities and parasite densities [3, 4]. Based on our high confidence in the ability of skilled microscopists in distinguishing Pv parasites and counting their densities, we conclude that it is possible to estimate the range of parasite density from the band intensity of the ICT.
Further studies using more samples, including parasite negative samples, mixed infection samples and post-treatment samples, may be needed in order to fully verify the utility of the ICT for quantitative diagnosis. In addition, the readers of the ICTs were blinded to the results of microscopic observation but band readings were subjective in this study. It could be improved as objective evaluations using serial diluted blood samples. Our studies have perhaps paved the way for the development of an improved ICT kit which can be used reliably for both rapid detection and quantification of malaria parasites in a patient’s blood.
Acknowledgments
We thank all the participants and staff of the Hospital for Tropical Diseases, Mahidol University, particulary the late Prof. Sornchai Looareesuwan who supported our collaborative research with kindness and dedication. This work was supported in part by a grant from the Office of the Higher Education Commission and Mahidol University under the National Research Universities Initiative and the Grant of National Center for Global Health and Medicine (21A-107).
REFERENCES
- 1.Moody A.Rapid diagnostic tests for malaria parasites. Clin Microbiol Rev 2002; 15: 66–78 [DOI] [PMC free article] [PubMed] [Google Scholar]
- 2.Makler MT, Piper RC. Rapid Malaria Tests: Where do we go after 20 years? Am J Trop Med Hyg 2009; 81: 921–926 [DOI] [PubMed] [Google Scholar]
- 3.Farcas GA, Zhong KJ, Lovegrove FE, Graham CM, Kain KC.Evaluation of the Binax NOW® ICT test versus polymerase chain reaction and microscopy for the detection of malaria in returned travelers. Am J Trop Med Hyg 2003; 69: 589–592 [PubMed] [Google Scholar]
- 4.Wongsrichanalai C, Arevalo I, Laoboonchai A, Yingyuen K, Miller RS, Magill AJ, Forney JR, Gasser RA., Jr.Rapid diagnostic devices for malaria: field evaluation of a new prototype immunochromatographic assay for the detection of Plasmodium falciparum and non-falciparum Plasmodium. Am J Trop Med Hyg 2003; 69: 26–30 [PubMed] [Google Scholar]
- 5.Coleman RE, Maneechai N, Rachapaew N, Kumpitak C, Soyseng V, Miller RS, Thimasarn K, Sattabongkot J.Field evaluation of the ICT Malaria Pf/Pv immunochromatographic test for the detection of asymptomatic malaria in a Plasmodium falciparum/vivax endemic area in Thailand. Am J Trop Med Hyg 2002; 66: 379–383 [DOI] [PubMed] [Google Scholar]
- 6.Richter J, Göbels K, Müller-Stöver I, Hoppenheit B, Häussinger D.Co-reactivity of plasmodial histidine-rich protein 2 and aldolase on a combined immuno-chromographic-malaria dipstick (ICT) as a potential semi-quantitative marker of high Plasmodium falciparum parasitaemia. Parasitol Res 2004; 94: 384–385 [DOI] [PubMed] [Google Scholar]


