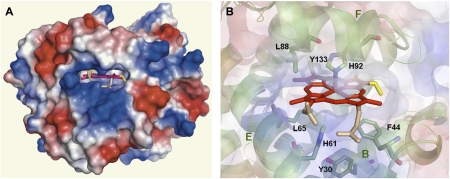
Fig. 4.
Heme pocket of soybean Lba [PDB accession 1BIN (44)] showing relevant α-helices and amino acid residues. (A) Electrostatic potential surface of the whole protein, showing heme localization. (B) Detail of the heme pocket. Ribbon diagram showing side-chains B, E, and F, with stick representation of the relevant amino acid residues, including proximal His92 and distal His61. The vinyl groups of the heme are highlighted in yellow and the propionic groups in pink. Electrostatic potential surface is overlapped as transparency. Molecular structures were inspected, analyzed, and plotted with PyMol (56).

