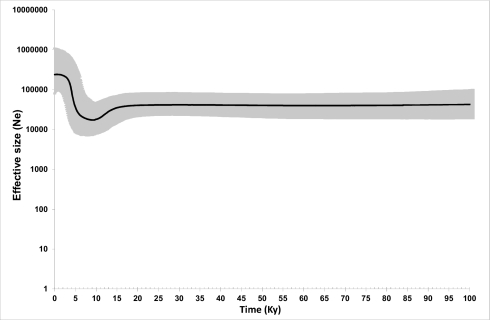
Fig. 4.
Bayesian skyline plot (BSP) showing the horse population size trend with a generation time of 8 y (52). The y axis indicates the effective number of females. The thick solid line is the median estimate, and the gray shading shows the 95% highest posterior density limits. The time axis is limited to 100 ky; beyond that time, the curve remains linear.

