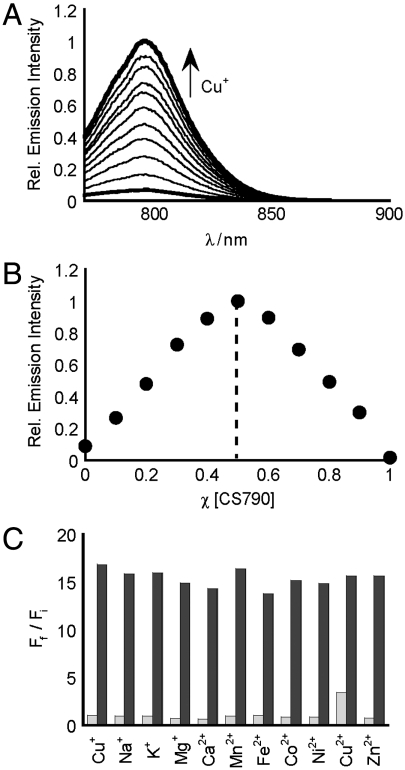
Fig. 2.
Spectroscopic characterization of CS790. All spectra were acquired in 20 mM Hepes, pH 7.0, at 25 °C. (A) Fluorescence response of 2 μM CS790 to 0–2 μM Cu+. Spectra shown are for [Cu+] of 0, 0.2, 0.4, 0.6, 0.8, 1.0, 1.2, 1.4, 1.6, 1.8, and 2.0 μM. (B) Job’s plot of CS790 and Cu+. The total concentration of CS790C and Cu+ were kept at 2 μM, and spectra were acquired using a λex of 760 nm and a λem of 790 nm. (C) Fluorescence responses of CS790 to various metal ions. Bars represent the final integrated fluorescence response (Ff) over the initial integrated emission (Fi). Light-gray bars represent the addition of an excess of the indicated metal ion (2 mM for Ca2+, Mg2+, and Zn2+; 20 μM for all other cations) to a 2 μM solution of CS790. Dark-gray bars represent subsequent addition of 2 μM Cu+ to the solution. Excitation was provided at 760 nm and emission was recorded at 790 nm.

