Fig. 5.
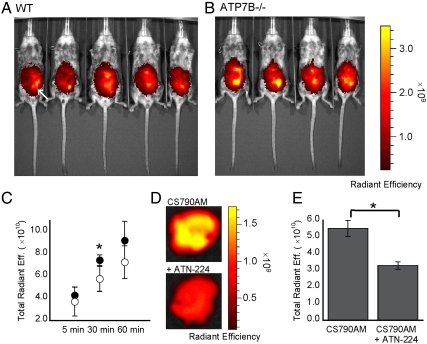
CS790AM studies in Atp7b-/- mice. (A and B) Images of WT (A) and Atp7b-/- (B) mice 30 min after injection of CS790AM (0.1 mM, 50 μL in 7∶3 DMSO : PBS). White arrow indicates location of CS790AM injection site. (C) Plot of total fluorescent signal from Atp7b-/- mice (black circles) and WT mice (white circles) 5, 30, and 60 min after CS790AM injection. (D) Representative images of livers from Atp7b-/- mice injected with PBS (i.p., 50 μL, Upper) or ATN-224 (i.p., 5 mg/kg in 50 μL PBS, Lower) 2 h prior to CS790AM. (E) Total photon flux from imaged livers. Statistical analyses were performed with a two-tailed Student’s t-test. *P < 0.05 [n = 5 (A), n = 4 (B), n = 2 (D)] and error bars are ± SD.

