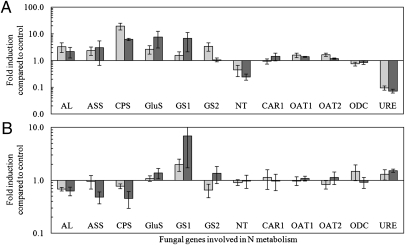
Fig. 3.
Fungal gene expression in the ERM (A) or IRM (B) after addition of 5 mM sucrose (light gray) or 25 mM sucrose (dark gray) to the RC. Data are expressed as fold induction compared with control (mean ± SEM of n = 4–6). Values <1 represent a decrease and values >1 an increase in transcript levels relative to control.

