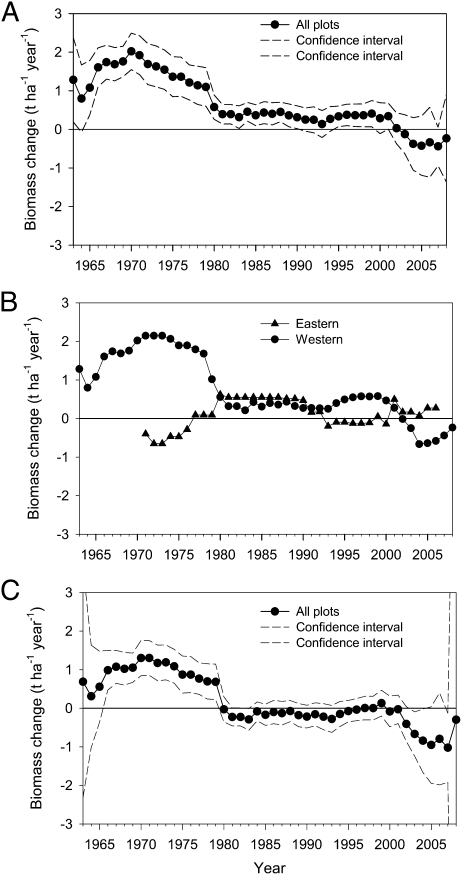
Fig. 2.
(A) Annual rate of change in aboveground biomass for all Canadian boreal forest plots combined from 1963 to 2008. The dotted lines represent 95% confidence intervals. (B) Annual rate of change of aboveground biomass for the western and eastern regions. (C) Annual rate of change in stand-age–corrected aboveground biomass for all Canadian boreal forest plots combined from 1963 to 2008. The dotted lines represent 95% confidence intervals.

