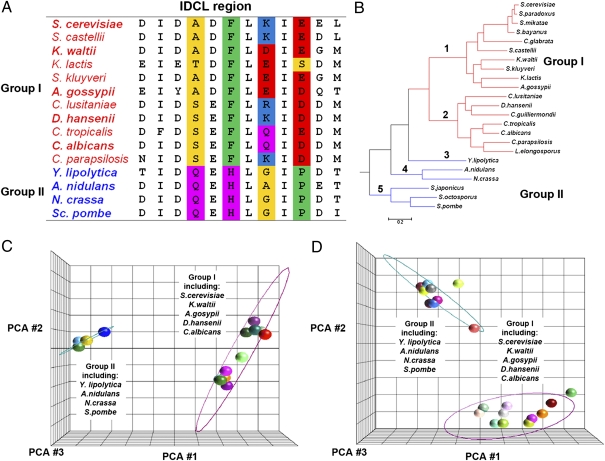
Fig. 2.
Bioinformatics analysis of PCNA IDCL sequences across different species indicates divergence into two groups. (A) Sequence alignment of the IDCL region indicates changes mainly in four amino acids (highlighted in color) that can be used to separate the sequences into two groups (group I and group II; highlighted in red and blue, respectively). (B) Species phylogenetic tree containing 23 well-annotated fungal species (11). Group I and group II are highlighted in red and blue, respectively. (C) PCA of PCNA IDCL sequences from 23 species, including 15 unique sequences, indicates divergence into two groups; representatives of group I and group II are highlighted. The ellipse was generated by measuring 3 SDs around the centroid of each group, using Partek. (D) Similar analysis performed on IDCL sequences from 53 species, including 21 unique sequences (Fig. S1) found on BLAST analysis of fungal sequences (http://www.yeastgenome.org/). PCA was performed using the Jalview and Partek programs. The color scheme of amino acids in A is according to Lesk (28). Small nonpolar residues (G, A, S, T) are highlighted in yellow, hydrophobic residues (C, V, I, L, P, F, Y, M, W) are highlighted in green, polar residues (N, Q, H) are highlighted in magenta, negatively charged residues (D, E) are highlighted in red, and positively charged residues (K, R) are highlighted in blue.

