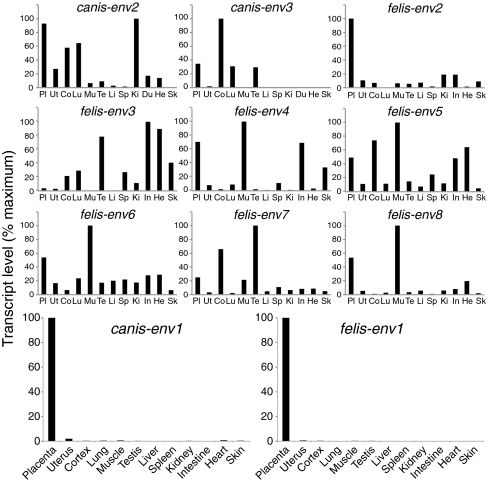
Fig. 4.
Real-time qRT-PCR analysis of the candidate env gene transcripts from dog and cat. Transcript levels are expressed as percent of maximum and were normalized relative to the amount of a control gene (PPIA) (Methods) RNA. The two placenta-specific canis-env1 and felis-env1 genes are displayed in enlarged panels in the fourth row; the same tissues (abbreviated and displayed in the same order) for the nine other env gene candidates are shown. Values for the placenta and uterus are the means of at least five samples for both dog and cat; RNAs of other tissues are from Zyagen.

