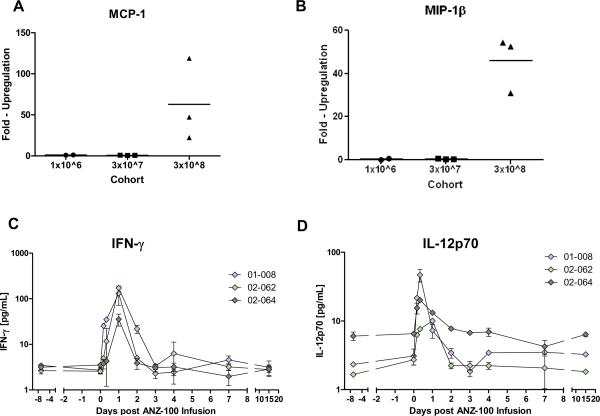
Figure 2. ANZ-100 induction of chemokines/cytokines is dose dependent and favors the induction of Th1 cytokines.
A, MCP-1 chemokine expression presented by cohort dose level. Ratio calculated from peak chemokine value 2 hours post-dose compared to mean chemokine value of two pre-dose measurements. At the highest dose level of 3×10⁸ cfu, a significant induction of MCP-1 was observed (p = 0.0006). B, MIP-1β chemokine expression presented by cohort dose level. Ratio calculated from peak chemokine value 2 hours post-dose compared to mean chemokine value of two pre-dose measurements. At the highest dose level of 3×10⁸ cfu, a significant induction of MIP-1β was observed (p = 0.0002). C, IFN-γ cytokine expression after ANZ-100 administration in subjects at the 3×10⁸ dose level. D, IL-12p70 cytokine expression after ANZ-100 administration in subjects at the 3×10⁸ dose level.

