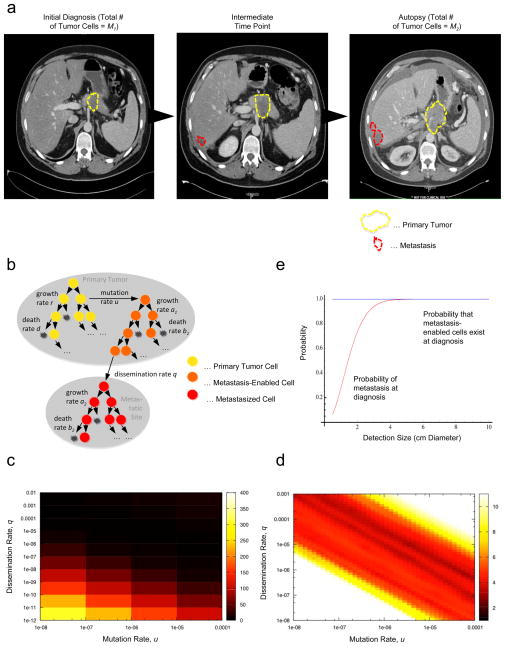
Figure 1. A mathematical framework of pancreatic cancer progression allows the prediction of growth and dissemination kinetics.
(a) Computed tomography (axial view) of one representative patient at initial diagnosis, one intermediate time point five months later, and then again at 7 months after diagnosis, which was also one week before death. In each image the primary pancreatic cancer is indicated in dashed yellow outlines and the liver metastases by dashed red outlines. (b) The mathematical framework. The model considers three cell types: type-0 cells, which have not yet evolved the ability to metastasize, reside in the primary tumor where they proliferate and die at rates r and d. They give rise to type-1 cells at rate u per cell division; these cells have evolved the ability to metastasize but still reside in the primary tumor, where they proliferate and die at rates a1 and b1, respectively, and disseminate to a new metastatic site at rate q per time unit. Once disseminated, cells are called type-2 cells and proliferate and die at rates a2 and b2, respectively. This mathematical framework can be used to determine quantities such as the risk of metastatic disease at diagnosis and the expected number of metastasized cells at death. (c and d) Estimated mutation and dissemination rates allow the prediction of the probability of metastasis at diagnosis. The color represents the deviations between the data and the results of the mathematical model; we used patient data on the number of metastatic sites and metastatic cells for the estimation, and then calculated the geometric mean of the two values for each point. Darker colors represent the region of fit between theory and data. Panel d provides a more detailed analysis of the data shown in panel c. (e) The panel shows the probability of metastasis at diagnosis (red curve) and the probability of the existence of cells in the primary tumor that have evolved the potential to metastasize (blue curve). Parameters are u = 6.31·10−5, q = 6.31·10−7, r = a1 = 0.16, a2 = 0.58, d = b1 = 0.01r, and b2 = 0.01a2.

