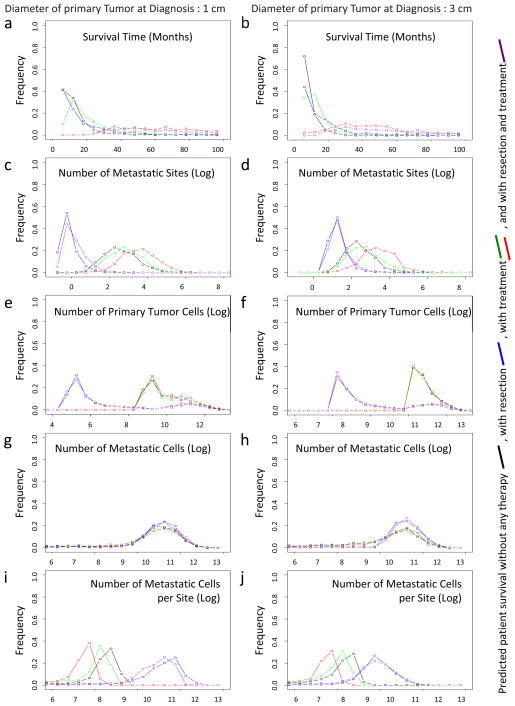
Figure 4. The mathematical framework predicts optimum treatment strategies for pancreatic cancer patients.
The panels show the predictions of different quantities for a tumor size of 1 cm diameter at diagnosis (left column) and 3 cm at diagnosis (right column). The tumor size at autopsy in a 10 base logarithmic scale was obtained from a normal distribution with mean 11.2 and variance 0.46 for each calculation. The growth rates of primary tumor cells and metastatic tumor cells were obtained from a normal distribution with mean 0.16 and variance 0.14; and mean 0.58 and variance 2.72, respectively. The black curve represents mathematical predictions of the survival time without treatment or resection, the blue curve with resection (removal of 99.99% of the primary tumor by surgery), the red and green curves with treatment (90% (red) and 50% (green) reduction of the growth rate), and purple curve with resection and treatment (removal of 99.99% of the primary tumor by surgery and 90% reduction of the growth rate). Parameters are u = 6.31·10−5, q = 6.31·10−7, d = b1 = 0.01r, b2 = 0.01a2, ε = 0.9999, and γ = 0.9 (red and purple curve) and γ = 0.5 (green curve). (a and b) Survival time. (c and d) The number of metastatic sites at autopsy. (e and f) The number of primary tumor cells. (g and h) The number of metastatic tumor cells. (i and j) The number of metastatic tumor cells per site. See also Figure S2–S7.

