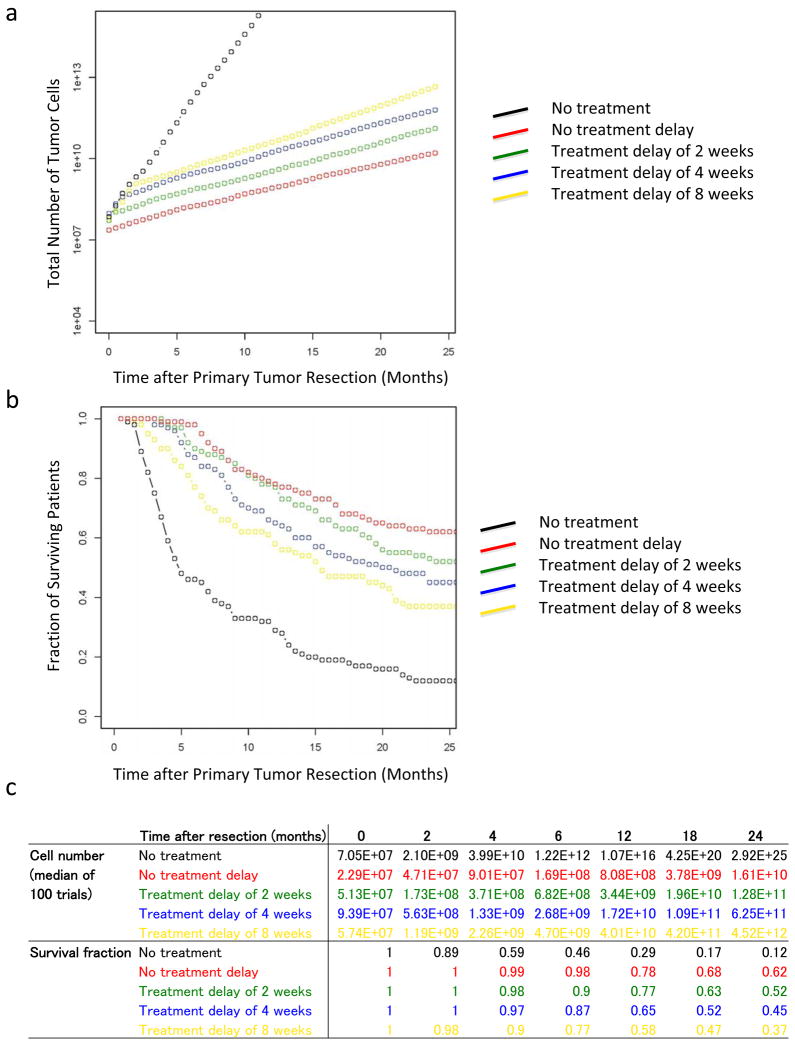
Figure 5. A delay in the initiation of therapy significantly increases tumor volume and shortens survival.
The panels show the prognosis after surgery with different theoretical treatment options and treatment delays. Panel a shows the median of the number of tumor cells in 100 trials over time. Panel b shows the fraction of surviving patients in 100 trials at each time point. Panel c shows the numbers of tumor cells and the fraction of surviving patients. The tumor size at autopsy was obtained from a normal distribution with mean 11.2 and variance 0.46 in a 10 base logarithmic scale. The growth rates of primary tumor cells and metastatic tumor cells were obtained from a normal distribution with mean 0.16 and variance 0.14; and mean 0.58 and variance 2.72, respectively. The black curve represents the case with no treatment after surgery, the red curve with starting treatment immediately after surgery, and the green, blue, and yellow curves with starting treatment 2, 4, and 8 weeks after surgery, respectively. Parameters are u = 6.31·10−5, q = 6.31·10−7, d = b1 = 0.01r, b2 = 0.01a2, ε = 0.9999, and γ = 0.7.

