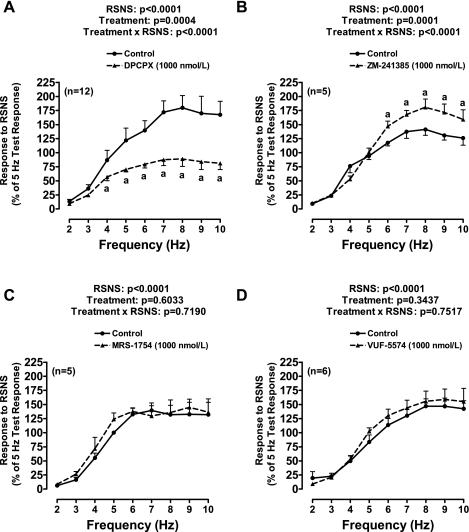
Fig. 4.
Line graphs show effects of DPCPX (A), ZM-241385 (B), MRS-1754 (C), or VUF-5574 (D) on perfusion pressure responses to RSNS. These experiments employed a paired experimental design in which both kidneys from the same rat were removed and perfused separately but simultaneously. Of each pair, 15 min before initiating RSNS, one kidney received vehicle only (DMSO) and the other kidney received one of the four antagonists (1,000 nmol/l). A frequency-response relationship was elicited by stimulating at 2, 3, 4, 5, 6, 7, 8, 9, and 10 Hz for 2 min at 15-min intervals. Responses were normalized to a 5-Hz test response that was elicited before drug treatments. A: basal perfusion pressures (before treatments) were 51 ± 2 and 53 ± 2 mmHg for the CON group and DPCPX group, respectively. Basal perfusion pressures were not affected by DPCPX. Test RSNS responses (before treatments) were 75 ± 6 and 85 ± 10 mmHg for the CON group and DPCPX group, respectively. B: basal perfusion pressures (before treatments) were 50 ± 2 and 46 ± 4 mmHg for the CON group and ZM-241385 group, respectively. Basal perfusion pressures were not affected by ZM-241385. Test RSNS responses (before treatments) were 82 ± 12 and 83 ± 15 mmHg for the CON group and ZM-241385 group, respectively. C: basal perfusion pressures (before treatments) were 45 ± 2 and 48 ± 3 mmHg for the CON group and MRS-1754 group, respectively. Basal perfusion pressures were not affected by MRS-1754. Test RSNS responses (before treatments) were 97 ± 4 and 111 ± 6 mmHg for the CON group and MRS-1754 group, respectively. D: basal perfusion pressures (before treatments) were 47 ± 2 and 44 ± 2 mmHg for the CON group and VUF-5574 group, respectively. Basal perfusion pressures were not affected by VUF-5574. Test RSNS responses (before treatments) were 105 ± 20 and 102 ± 20 mmHg for the CON group and VUF-5574 group, respectively. aP < 0.05 compared with CON group at corresponding frequency of RSNS. The P values in the figure are from repeated-measures 2-factor ANOVA. Values represent means ± SE for the indicated number of experiments (n).

