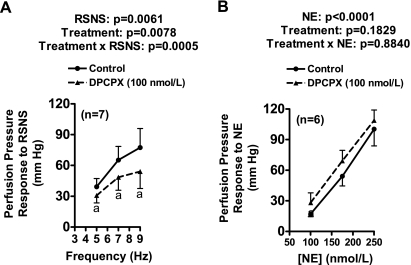
Fig. 5.
Line graphs show effects of DPCPX on frequency-dependent perfusion pressure responses to RSNS (A) and concentration-related perfusion pressure responses to exogenous norepinephrine (NE; B). Basal perfusion pressure was 63 ± 3 mmHg and was unaffected by DPCPX. aP < 0.05 compared with CON group at corresponding RSNS frequency. The P values in panels are from 2-factor ANOVA. Values represent means ± SE for the indicated number of experiments (n).

