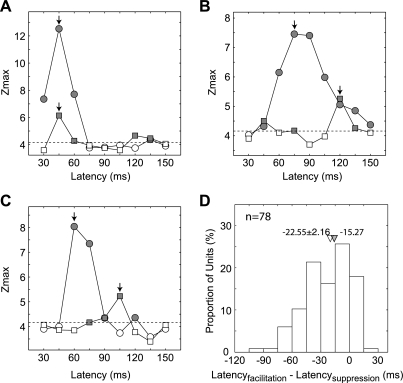
Fig. 12.
Differences in correlation delays (latency) between the facilitatory and suppressive subfields. A–C: examples of correlation delays. The Zmax values are shown at different delays for facilitatory (circles) and suppressive profiles (squares). Filled data points signify Zmax values that are significant. Arrows indicate the latency at which the peak response occurred for the facilitatory and the suppressive profiles, respectively. D: distribution of the differences in correlation delays (latency) between facilitatory and suppressive subfields. Filled inverted triangle indicates median value, and open inverted triangle indicates mean ± SE.

