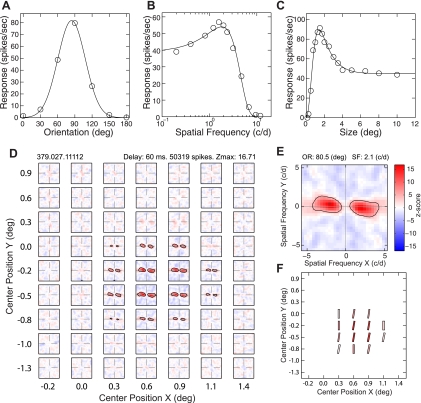
Fig. 2.
A spatial matrix of subfields with facilitatory profiles in a V2 neuron that exhibited spatial homogeneity of orientation and SF within its receptive field. A–C: selectivity to the orientation (A), SF (B), and size (C) measured using sinusoidal grating stimuli (temporal frequency 3.1 Hz; contrast 80%). D: spatial matrix of subfields with facilitatory profiles (2D spatial frequency tuning) obtained by changing iteratively the center position of the Gaussian window shown in Fig. 1. E: detailed profile of the subfield with the maximum Z score. F: schematic diagram showing the preferred orientation (bar angle) and SF (width) and the maximum Z scores (saturation) of the subfields illustrated in D. Zmax, maximum Z score.

