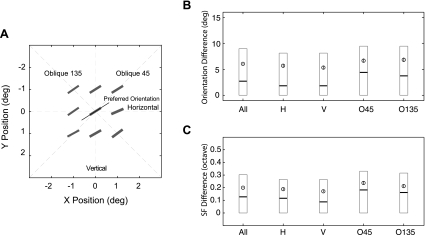
Fig. 7.
Spatial homogeneity of subfields with facilitatory profiles along 4 major orientation axes. A: analysis method for a representative V2 neuron. The preferred orientation and spatial frequency of subfields are illustrated with short bars, and the preferred orientation of the unit determined with grating stimuli is shown with a thin line. B: statistics of the orientation difference in each major axis. Open circles and vertical bars represent means ± SE. Each box represents the 3-quartile range with each horizontal bar representing a quartile value. C: statistics of the SF difference in each major axis.

