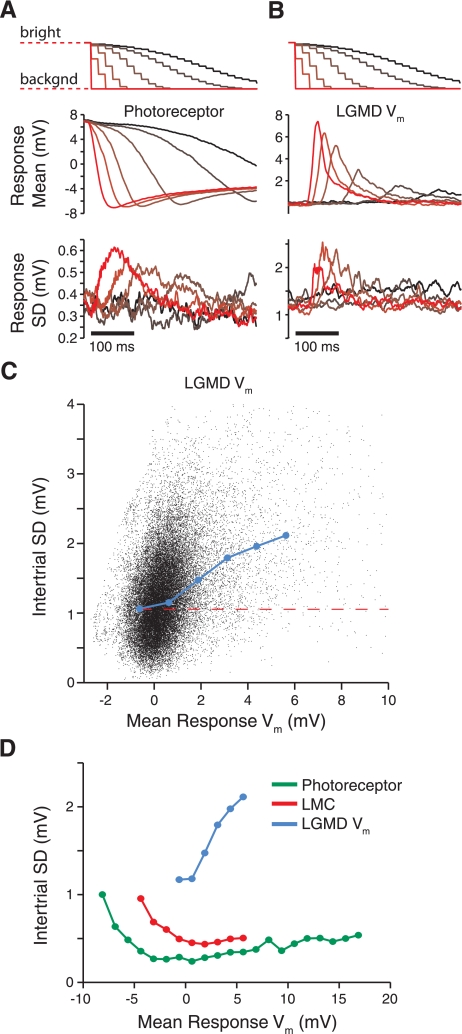
Fig. 2.
Time course and dependence of variability on Vm during single-facet stimulation. A and B: top traces show the stimulus luminance presented to a single facet over time. The luminance is initially bright and returns to its background (backgnd) value, causing the “off” response along the visual pathway. Darker colors denote slower luminance changes; brighter colors are faster. Middle traces depict correspondingly colored mean photoreceptor (A) and LGMD responses (B), averaged over all cells. The mean Vm are given relative to rest. Photoreceptors are initially depolarized, since the initial light level is above its background value. Bottom traces show the intertrial SD of the responses, averaged across recordings. C: response means and SD for the LGMD Vm (from B) plotted against each other, with each black point showing a time sample (selected at 2.5-ms intervals). The blue line shows the average resulting SD within 1.25-mV mean response bins for bins that contain >0.05% of the data. The dashed red line indicates the spontaneous noise level (Fig. 1E). D: same analysis as in C for photoreceptors (green), LMCs (red), and the LGMD Vm (blue; replotted from C).

