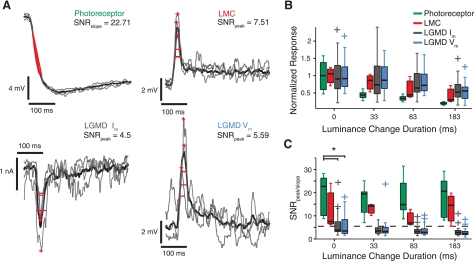
Fig. 3.
Variability and signal-to-noise ratio (SNR) of response features to single-facet stimuli. A: representative traces for each cell type showing the trial-by-trial variability of responses to an instantaneous luminance decrease at a single facet (0-ms duration). The stimulus occurs at the time the traces begin. Trial averaged responses are shown in black and 3 individual trials in gray. Measured features are depicted in red for each trial: for photoreceptor traces, they are the response slopes from 25–75% of the response height; for LMC and LGMD traces, they are the peaks (+) and response widths (full width at half-height, FWHH). The SNR is noted for the peak and slope features for the experiments shown. It is defined as the mean divided by the SD of each measured feature. B: relative response strengths (photoreceptor slopes; peak heights for other recording types) to single-facet luminance changes of varying duration. For each box plot, the central horizontal line denotes the median and the box extent depicts the 25th (p25) to 75th percentile (p75) data range. Whiskers show the range of data not considered outliers, and plus signs represent outliers, i.e., points >1.5 (p75 − p25) times away from lower (p25) or upper (p75) data quartile. Responses are normalized to the mean of the population distribution (at 0-ms duration) for each recording type (photoreceptors, 5.5 mV/10 ms; LMCs, 7.2 mV; LGMD Im, 2.0 nA; LGMD Vm, 9.3 mV). C: SNR as a function of luminance change duration for the recording types. Box plots conventions are as described in B. The dashed line shows the mean SNR of the LGMD Vm peak for pseudolooming stimuli, a stimulus type that targets 45 facets in a pattern that mimics some aspects of a looming stimulus. There is a significant effect of recording type at 0-ms luminance change duration (*PKW = 0.0023, corrected for multiple comparisons using HSD criterion). See Data analysis and statistics for definitions of probability statistics.

