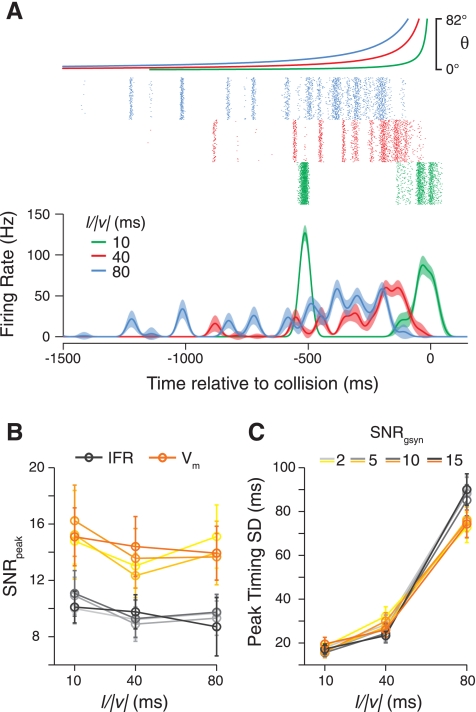
Fig. 7.
How input variability shapes LGMD model responses. A: the spiking and IFR of the LGMD model if single-facet luminance change-dependent jitter is removed. Instead, the synaptic times are jittered in the model by an amount drawn from a normal distribution with an SD set at a constant value of 4 ms. B and C: the variability of LGMD model responses is insensitive to changes in the variability of the underlying synaptic input strength. The SNR of the peak firing rate (B) and SD of the time of the peak firing rate (C) are shown for simulations where the synaptic input strength has different levels of variability, as parameterized by the SNR of the excitatory synaptic input strength (SNRgsyn). Darker lines indicate higher SNR values. Measurements using both the Vm (orange) and IFR (grays) are shown. Values are compiled using 100 simulations per condition. Error bars show bootstrapped 95% confidence intervals on the values.

