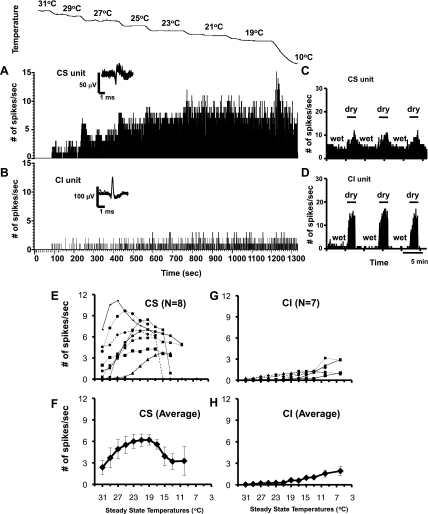
Fig. 1.
A–D: peristimulus time histograms (PSTHs) showing responses to steady-state (SS) temperatures (A and B) and to dry and wet stimuli (C and D) applied to the cornea in cold-sensitive (CS) and cold-insensitive (CI) corneal afferents. CS and CI units were recorded simultaneously from the same microelectrode but were discriminated by the shape of the waveforms (insets above PSTHs, 10 superimposed spikes) using software. The records in A and C were from 1 unit; those in B and D were from another unit. The timescale in B applies also to A. E–H: individual (E and G) and averaged (F and H) SS temperature-response profiles of CS and CI corneal afferents. Average graph values are means ± SE.

