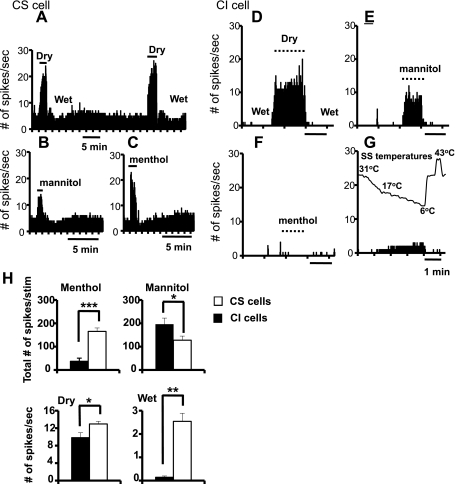
Fig. 2.
PSTHs of a CS (A–C) and a CI corneal afferent (D–G) in response to a variety of ocular stimuli. Notice that there was little or no response to menthol and temperatures, whereas the responses to dry and hyperosmolar stimuli were substantial. H: average graphs showing the differences in response to 4 types of ocular stimuli in CS and CI corneal afferents. The sample sizes for CI and CS units, respectively, were 6 and 25 for menthol (50 μM), 6 and 15 for mannitol (585 mOsm), and 10 and 60 for dry and for wet responses. *P < 0.05; **P < 0.01; ***P < 0.001.

