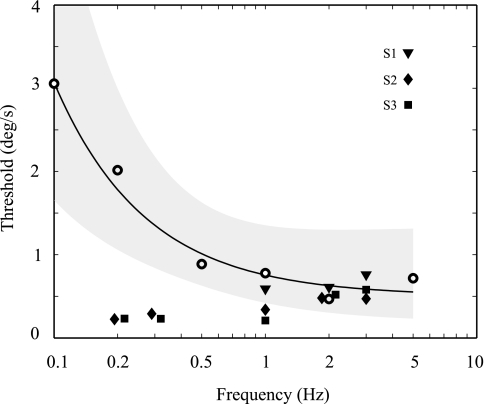
Fig. 6.
VOR “one-sigma” thresholds (Tσ) compared with human perceptual thresholds. Filled symbols show the VOR thresholds for each of the 3 monkeys plotted vs. frequency. The frequency for some data points is offset slightly for clarity. For context, the open symbols show average human perceptual thresholds (Grabherr et al. 2008) converted to one-sigma thresholds. The solid line shows the least-squares fit to the human threshold data, with the shaded area indicating 1 standard deviation from the mean. Because of lognormal distribution of human thresholds, standard deviations are not symmetrical on plot. VOR thresholds shown are from the less conservative analysis.

