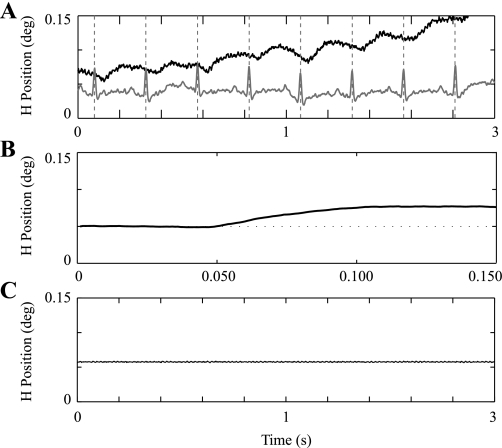
Fig. 7.
Eye oscillations. A: time traces of horizontal eye position (black) and cardiac potential (gray) show a small eye oscillation that appears synchronized with cardiac potential. Such oscillations were observed in all 3 animals and were observed on roughly half of the trials. The oscillations typically had a frequency between 2 and 4 Hz and were only observed when the small eye displacement traces were expanded for near-threshold eye motion. B: example of average eye oscillations synchronized with the peak of an electrocardiogram signal acquired simultaneously. Note that B has a very different time scale from A. C: example time trace with stationary calibration coil to demonstrate relative size of electronic coil measurement noise.

